Vova's Blog
I write about machine learning and finance
Compound interest in the market
by Vladimir
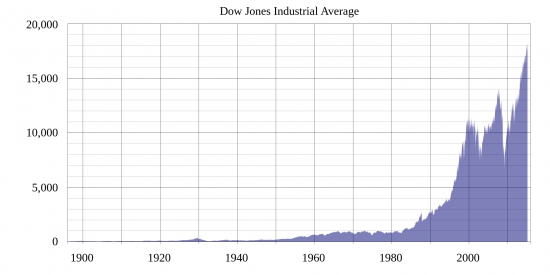
Here kind of and to the fool it is clear that earlier the market was "quiet and peaceful," and in the last decades it is direct "wild and feverish."
But, I suggest looking at one schedule. On the same, only constructed not in linear axes, and in logarithmic. It is necessary "to make even" identical percentage change of the market on the different temporary periods. In that case, we will see more objective dynamics of the index. The constructed schedule is given below.
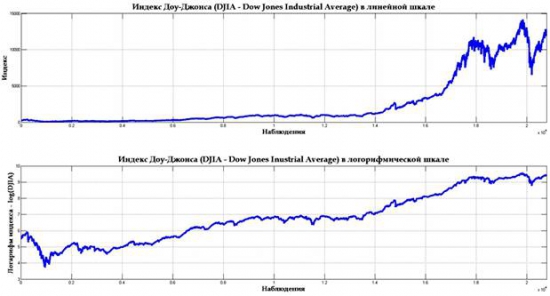
In the top part linear axes, in lower logarithmic.
The similar schedule suggests an opposite idea. Namely that the market became "quieter" in comparison with the 20th century. It, in the trailer, easily is explained by the inflow of liquidity on all leading platforms and development of market making. Anyway, draw a conclusion, but it is necessary to understand that severe percent can easily confuse.